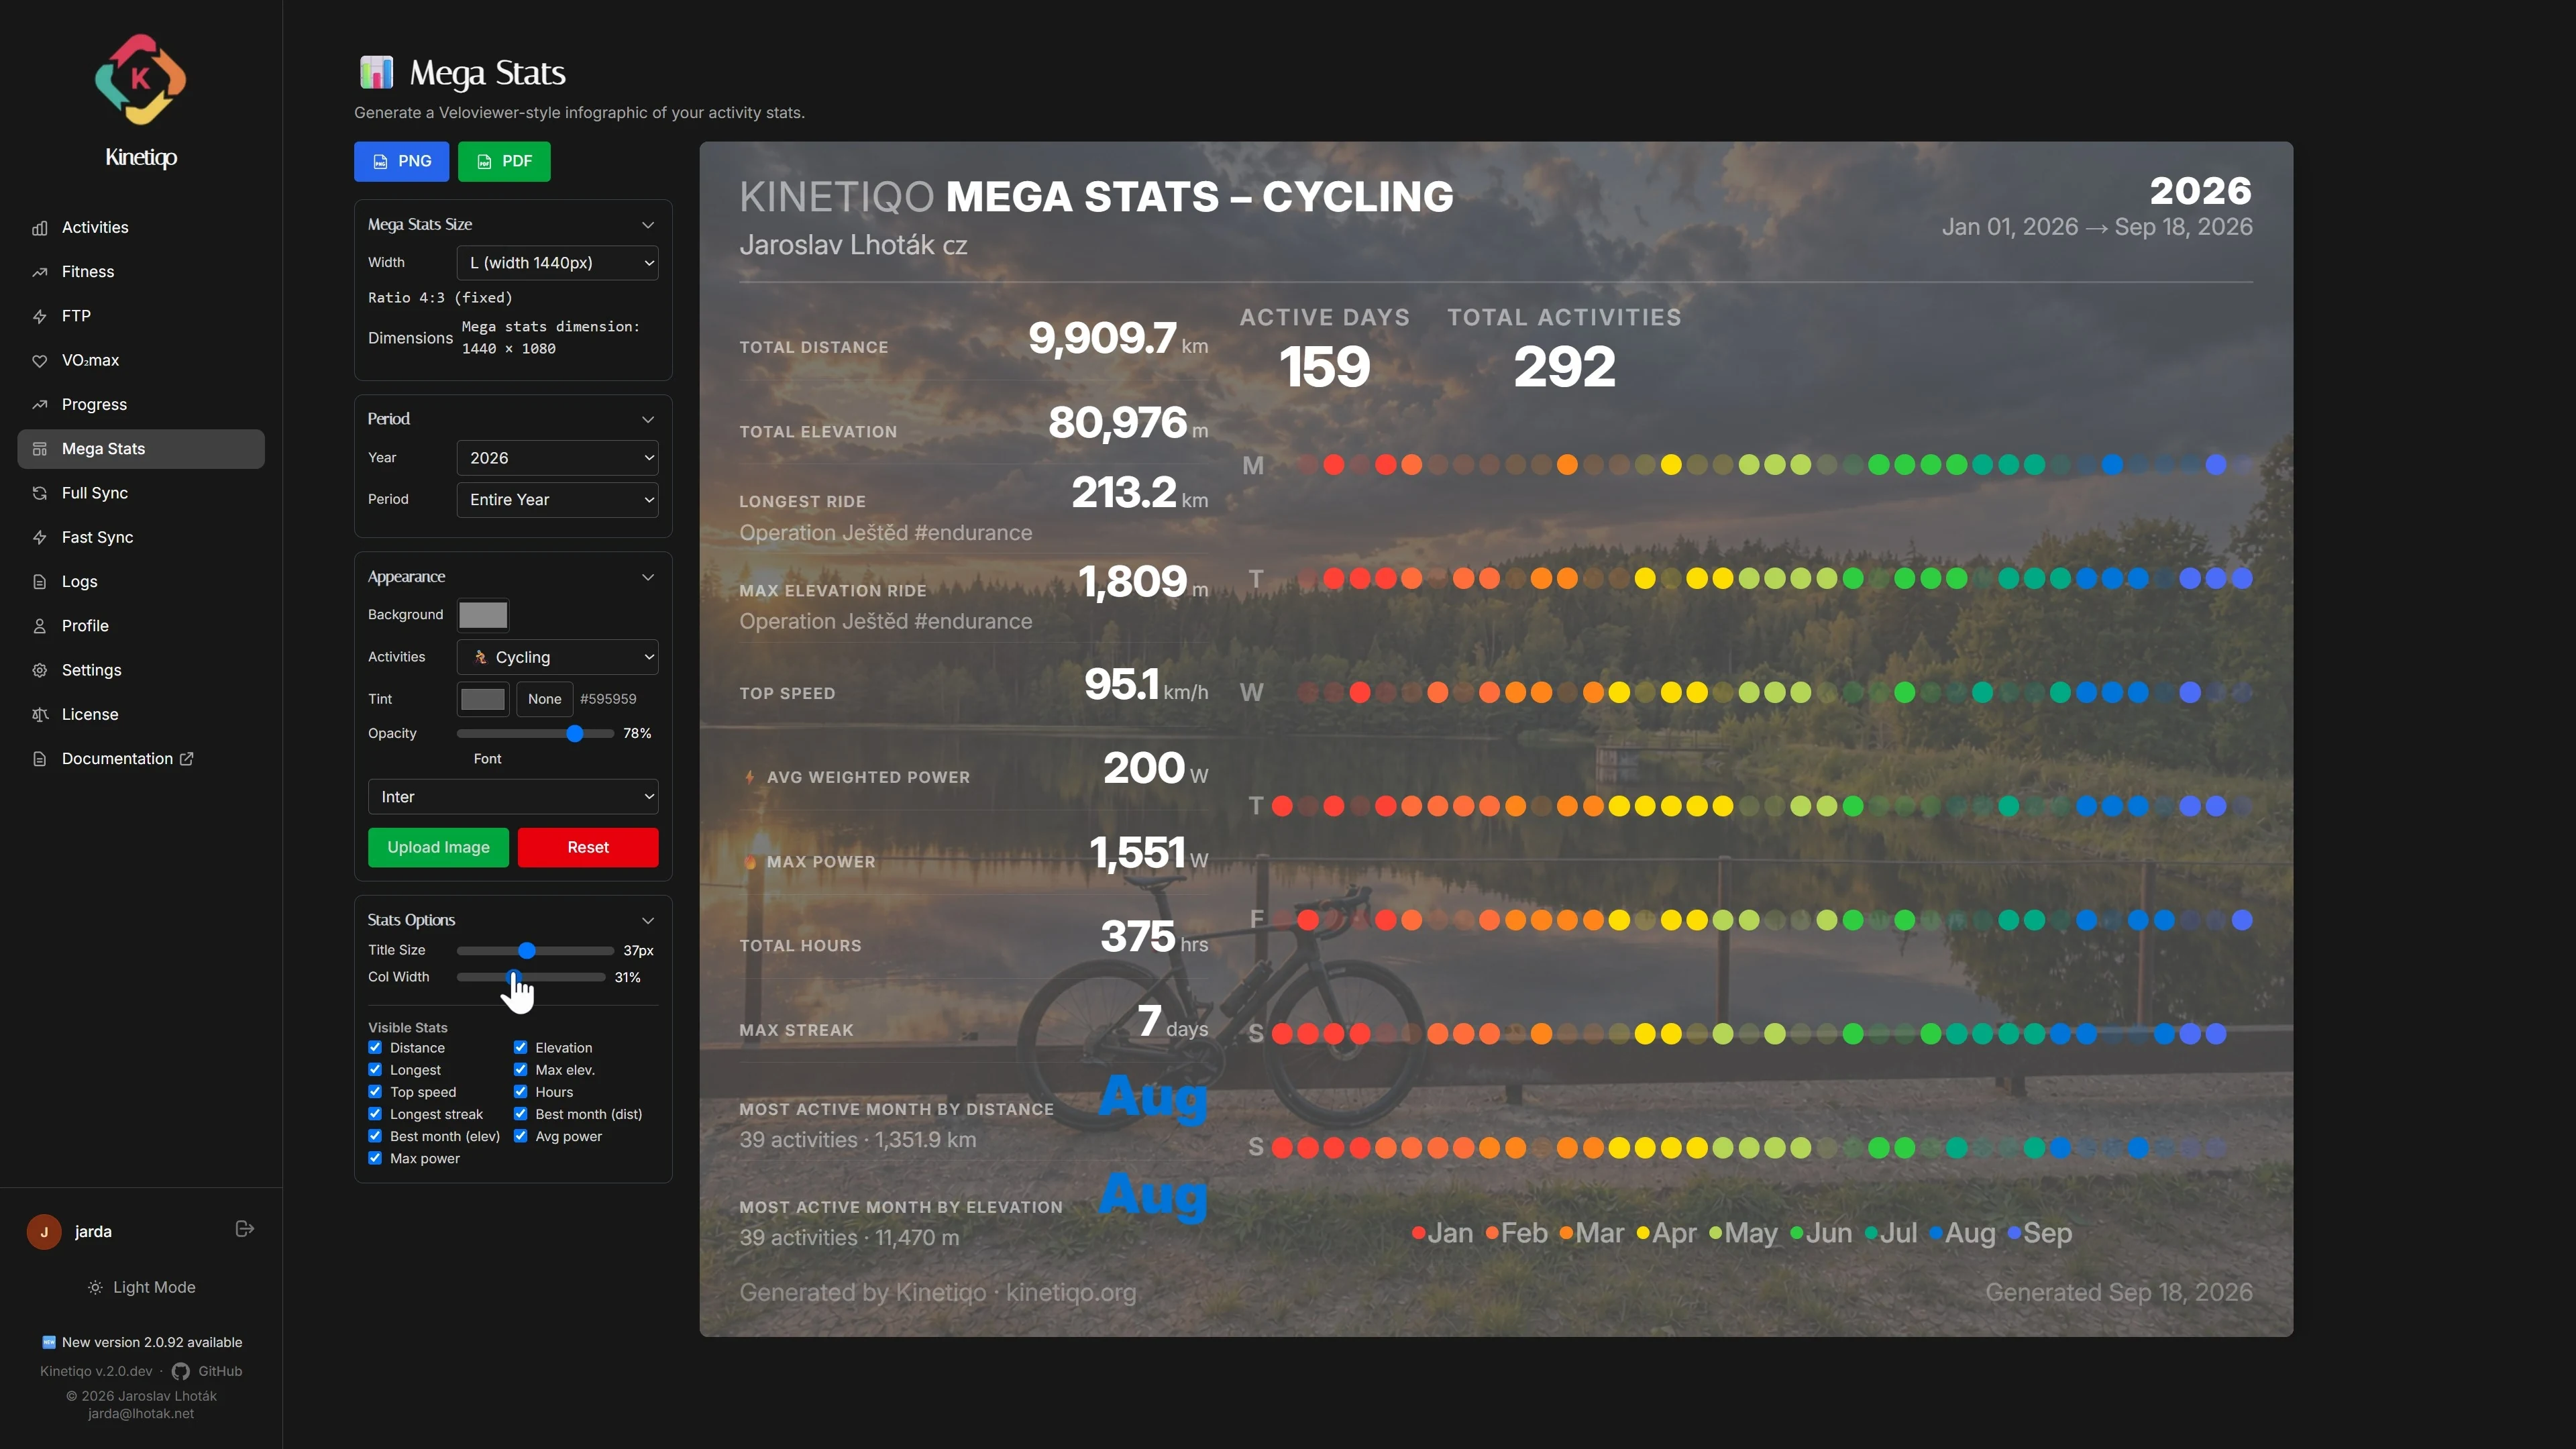
Generate high-impact year-end and milestone infographics summarizing your distance, elevation gain, longest efforts, and active day heatmaps.
Infographic Builder
Configurable Achievement Layouts
Customize which metrics appear on your infographic card. Toggle longest ride, total elevation, active days, average speed, and power achievements while adjusting column width, typography scaling, background photo, and tint overlay in real time.
Period selection: Full Year, Half-Year, Quarter, or Custom Date Range
Discipline filtering: Cycling, Running, Hiking, or All Multisport
Custom photo background (PNG, JPG, WEBP, HEIC) with tint color picker & opacity slider
Typography font selector (Inter, Italiana, Outfit, Fanwood Text)