Power Skills, FTP & VO₂max Analytics

Scientific power duration modeling, training stress balance tracking, and automated threshold power estimation.

Radar Spider Chart

Power Duration Skills Profile

Visualize your strengths across sprint (5s), surge (1min), VO₂max (5min), threshold (20min), and endurance (1h) power durations relative to your peak historical performances.
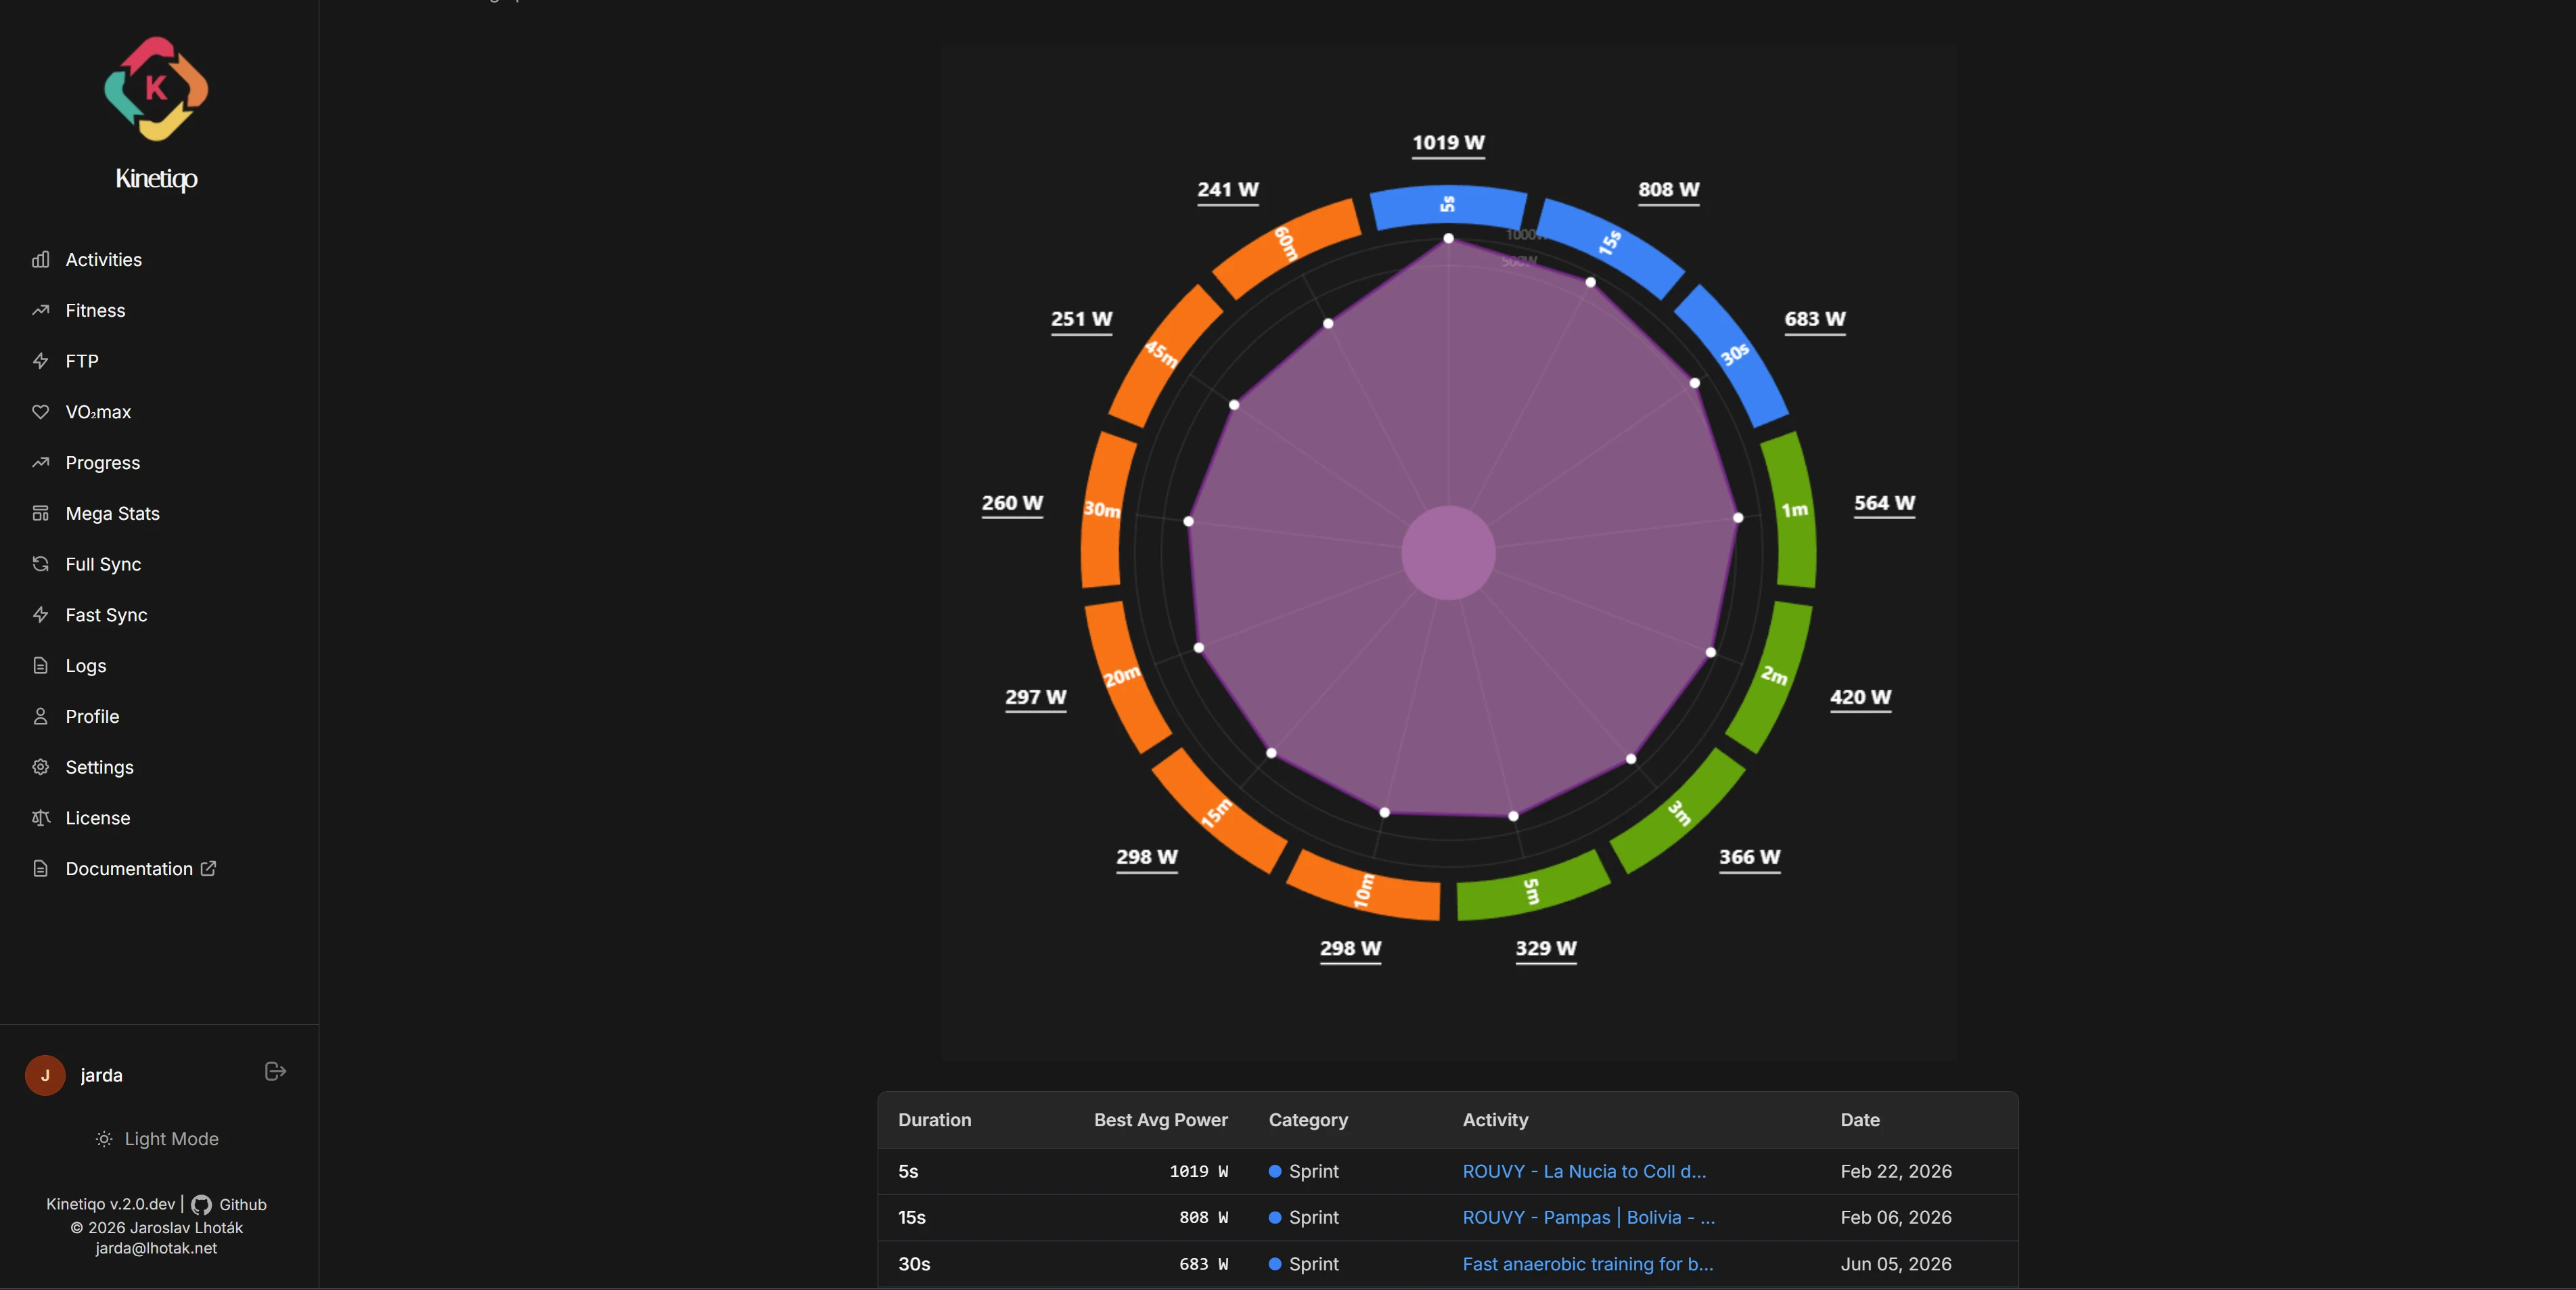
  • 5-second max sprint power tracking
  • 1-minute anaerobic surge capacity
  • 5-minute maximum aerobic power (MAP)
  • 20-minute threshold & 60-minute sustained endurance
Power Duration Radar Chart
Training Load Modeling

Fitness, Freshness & Fatigue (CTL / ATL / TSB)

Powered by pandas and the Banister impulse-response model. Tracks Chronic Training Load (CTL / Fitness), Acute Training Load (ATL / Fatigue), and Training Stress Balance (TSB / Form) over custom time windows.
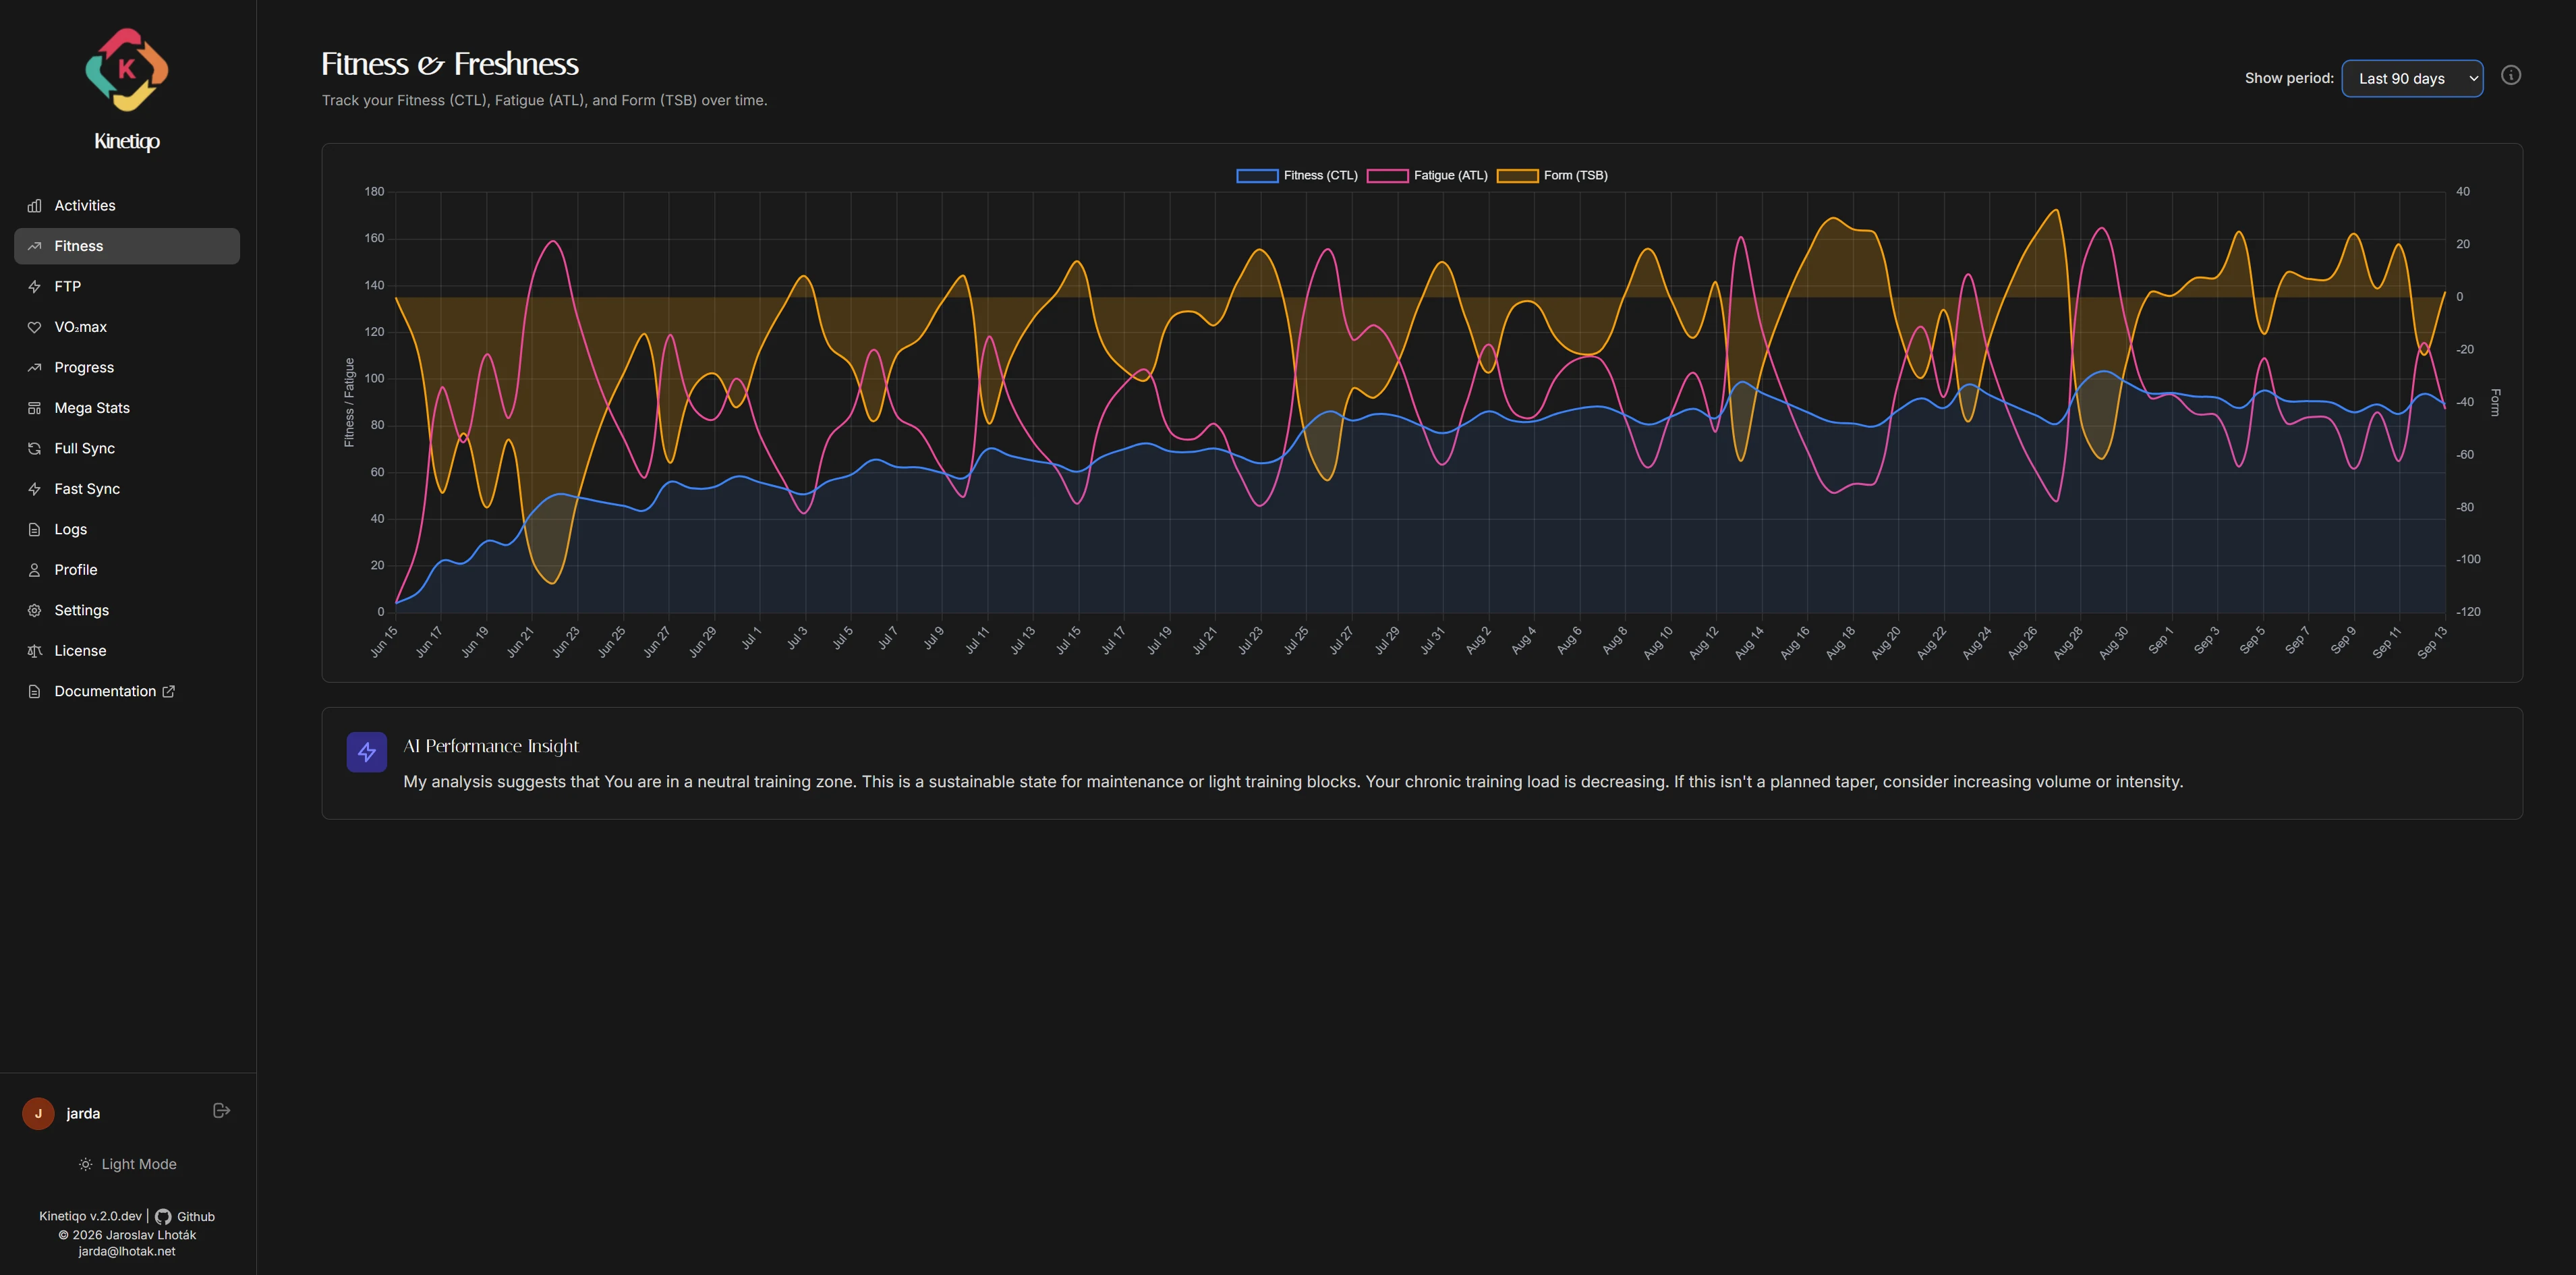
  • 42-day exponentially weighted CTL (Fitness) curve
  • 7-day exponentially weighted ATL (Fatigue) curve
  • TSB (Form = CTL - ATL) for race readiness optimization
  • Automated 95% 20-min FTP tracking & Townsend MAP VO₂max estimates
Fitness and Freshness CTL/ATL/TSB Chart